Time is Money and Wood Supply | What is a Long Wait Time?

As the frost penetrates the soil and the ground freezes, the forests of the Lake States region become more accessible. From December to March, some mills in the region will harvest more than 60% of their annual wood supply. Daily wood deliveries to mills will nearly triple during this time period, and it’s critical that operations are maximizing efficiencies to meet quotas. This includes turn-times at the mill when delivering timber.
Wood procurement managers and foresters frequently hear about longer than expected wait times from suppliers. Rightfully so, as long wait times directly impact the bottom line of suppliers, with increased trucking and employee costs. In terms of the mills’ perspective, the long wait will cost them fiber supply and added costs to bring suppliers back, especially in areas where there is market competition for limited fiber supply. Furthermore, the relationships established between the mills’ procurement staff and suppliers may become stressed. For these reasons, it’s in both parties’ interests to minimize wait times at the scale when delivering logs.
Both parties have a shared responsibility in minimizing scale-in and scale-out times (turn-times). The supplier needs to train his drivers and in-woods workers about the mills and where the product will be delivered. Suppliers need to inform employees or contractors of scale-in and scale-out procedures, how to approach and exit a scale, woodyard layout, safety precautions while operating in the woodyard, personal protective equipment (PPE) required, log specifications, and species the mill is accepting. It is also important that the supplier has properly and safely maintained equipment.
The mill has the responsibility to scale-in and scale-out trucks in the most efficient manner that will minimize wait time. The mill must provide clear communication on the expectations for woodyard safety and procedures to contractors delivering to the facility. In addition, the mill should provide properly trained equipment operators, maintain woodyard roads and landings in good condition, establish clear communication with drivers of what landing to deliver logs, have adequate and well-maintained equipment, and have proper staffing levels to quickly unload trucks. Mills expect loggers to have their equipment in good operating condition to maximize logging productivity; there is no reason why loggers should not expect the same from the mills.
So when someone complains about a long wait time, what do they mean? Most mills track scale-in and scale-out times. This metric is used to determine average wait times on a daily basis. But, how can one determine what an appropriate wait time is and how much waiting is, well too long? If you said statistics, you are right.
Analytics should be developed by the mill that provide, within a degree of confidence, the anticipated scale-in/scale-out time a supplier can expect. Variables to consider are individual turn-times and the number of loads delivered per day. From this information, an analysis can be performed that will calculate the relationships of turn-times based on loads per day. A chart can be developed and shared with suppliers regarding what to expect in terms of turn-times. An example of what this chart would look like is provided in Figure 1.
During busy times of the year, scale-in/scale-out times may not be a true depiction of a long wait time from the loggers’ perspective. During the busy winter logging season in the Lake States, lines may become long and suppliers experience a long wait time prior to scaling-in. In these busiest of times, the mill can provide suppliers with a “busy time of day” chart. This will allow the supplier to make a business decision based on this information with respect to the time of day to schedule deliveries. Figure 2 is an example of a busiest times of day chart.
Mills may also want to consider lengthening scale hours during this busy season. To justify longer scale hours, mills should develop a break-even analysis that determines the minimum number of loads that must be delivered during the specified time period to justify scale and woodyard staffing.
In addition to informing suppliers, tracking and analyzing turn-times may assist procurement managers to identify bottlenecks in the process. This information shared internally with woodyard or scaling employees will help them recognize where efficiencies could be made. These efficiencies may be as simple as limiting conversations of scalers with suppliers, or a more thorough analysis which shows the cost of how poorly maintained equipment can have a negative impact on wood deliveries. Figure 3 provides an example that shows the relationship between increased turn times and reduced deliveries due to a scale failure.
Time is money and wood supply. Both the supplier and mill want to optimize turn-times at the scale. Both parties share in this responsibility. An analysis of turn-time data and sharing this information with suppliers will provide an understanding of what to expect when delivering wood to a mill. This type of analysis will also benefit the mill by assisting in determine inefficiencies that will assist to improved turn-times.
For information on how to develop metrics around turn times see Technical Release 18-R-38.
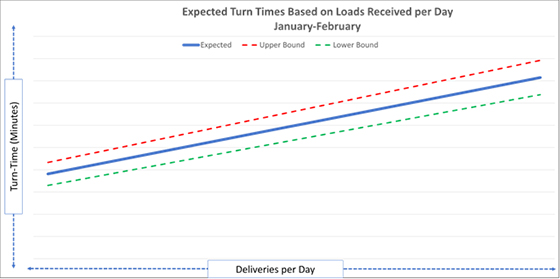
Figure 1. Expected scale-in/scale-out times chart with 90% confidence intervals. This chart provides an expected turn-time for deliveries based on number of loads received per day. The mill should expect 90% of deliveries to be within the upper and lower bounds.
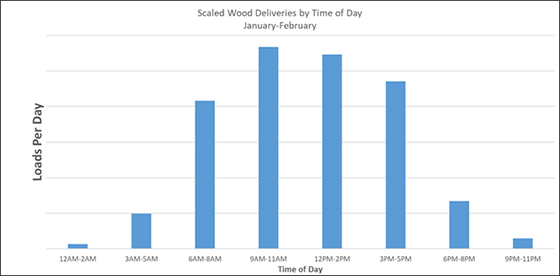
Figure 2. Scaled wood deliveries by time of day. This information can be shared with suppliers to inform them of the busiest times (longer waiting lines) to be scaled-in and scaled out. With this information, suppliers can make an informed decision with respect to wood deliveries from his operation to the mill.
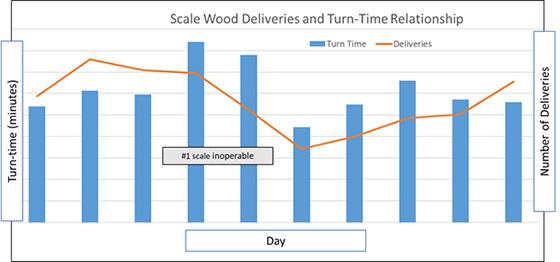
Figure 3. Scale turn time analysis. This example shows that as turn-times increased the number of delivered or scaled loads decreased. This type of analysis shows the relationship between poor turn-times and wood supply being delivered to the mill. In this example, a scale being down resulted in longer turn times.

A forest road in northern MN. In the winter these roads are used almost exclusively to haul logs from the “Woods to the Mill.”