The Forest Inventory and Analysis (FIA) Program: Keeping Score of America’s Forests

The Forest Inventory and Analysis (FIA) program of the U.S. Forest Service is essentially the scorekeeper for America’s forests. The FIA program monitors and reports on status and trends of all the nation’s forests, including both public and private ownership. The Research and Development organization within the USDA Forest Service manages FIA in cooperation with State and Private Forestry and National Forest Systems. FIA traces its origin back to the McSweeney – McNary Forest Research Act of 1928 (P.L. 70-466). This law initiated the first inventories starting in 1930.
The FIA program provides periodic information on the status and trends on a variety of parameters describing forests and forest use: area and type of forest; structure; and composition of forests in terms of species, sizes, and volume; rates of tree growth, mortality, and removals; patterns of ownership of forest lands; and information on harvest efficiency and product flows throughout the US. This information is of vital interest to numerous customers including managers, policy makers, business interests, academics, and others.
Over the years, the Forest Service has significantly enhanced the FIA program by changing from a periodic survey repeated every twelve to fifteen years, to an ongoing annual survey. It has also increased its capacity to analyze and publish data and has expanded the scope of data collection to include soil, under story vegetation, tree crown conditions, coarse woody debris, and lichen community composition on a subsample of plots. Recently, the FIA program has even expanded to include the sampling of urban trees on all land use types in select cities.
The FIA program consists of a collection of four related surveys designed to focus on different aspects of America’s forested ecosystems. The surveys include:
- Forest Monitoring – a three phase sample used to track status and trends in forest extent, cover, growth, mortality, removals, and overall health;
- Ownership Study – a questionnaire-based survey of landowner plans, desires, values, and intentions.
- Timber Product Output – A questionnaire-based survey of wood processing facilities used to track the commercial production of wood products.
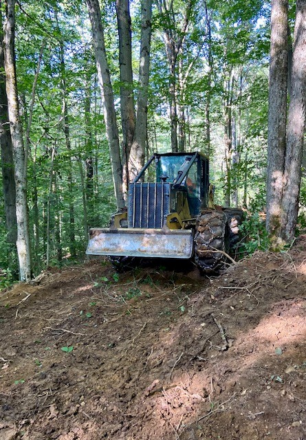
- Utilization Studies – studies conducted on logging sites to record how much wood is removed during harvest.
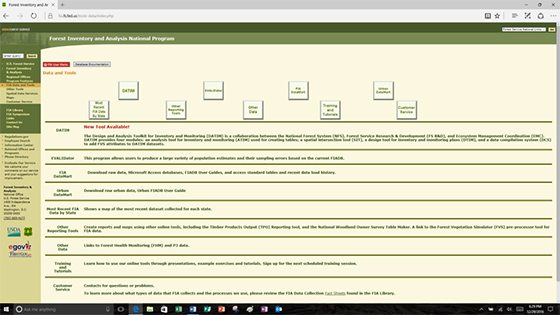
The FIA program contains the largest and most comprehensive forest inventory data set for the entire United States. A variety of tools allow users to either download standard reports or to create custom queries. The website also includes user guides, tutorials, and training materials – all of which make it possible for anyone to learn how to use the tools and to extract data specific to their individual needs.
Users can query the data and download reports for any area of interest by using one or more of the various tools found on the FIA website ( https://www.fia.fs.fed.us/ ) in the FIA Data and Tools tab:
For new users, just deciding what area(s) of interest to choose can be a challenge. Although it may be relatively easy to extract data from the FIA database by using one or more of the tools available on the FIA website, it is also important to understand the limitations of the data accuracy. FIA forest monitoring survey data is based on one field sample site for each 6,000 acres of forest, but some states and regions provide funding for more intense sampling which yields more reliable data.
Power users of FIA data can be found both in the public and private sectors. These users have far more robust computer systems and better connections to the FIA database than casual users accessing the data through the public website. One such public-sector user is Andy Stoltman, who heads up Wisconsin’s DNR Forestry GIS unit. Andy notes the FIA program’s strength is providing reliable data on an annual basis for basic forest metrics such as growth, removals, and mortality. He also likes the way the programs has been modified in recent years with the addition of microplots which capture data that shows trends relating to issues such as invasive species, deer browse, droughts, earthworms, and oak wilt.
A power user from the private sector is Tom Hittle, Senior V.P., Project Coordination and Business Development with Steigerwaldt Land Services, Inc. (SLS) from Tomahawk, Wisconsin. Tom sees FIA as a great tool for assessing the big picture view of forest resources at the state or region level. His SLS team manages forestry and timber harvesting operations on about 425,000 acres in various parts of the U.S., and also provide customized forest modeling and resource assessment services for both public and private sector clients. FIA data sets are often incorporated in many of the finished products as baselines.
Once a person learns to navigate the FIA website and becomes familiar with the using the tools and how to download data, it is often tempting to zoom in to analyze a specific location or attribute. Doing this may result in a large sample error, as the number of sample plots decreases when focusing on small areas, single species, ownerships, etc. Failure to consider sample error is one of the most common mistakes casual users make.
Another thing that one needs to consider are the definitions. For example, there is much more forest land in the U.S. than timberland. The definition of forest land includes marginally productive lands and lands where timber production is explicitly forbidden. Timberland includes forest land that is producing or is capable of producing crops of industrial wood and not withdrawn from timber utilization by statute or administrative regulation.
Based on FIA data for America’s forests, what is the score? Are we winning? Or are we losing?
To help answer that question, here is a big picture summary of some key metrics for all public and private timberland from 2012 and 1952, showing the percentage change of each metric over the 60-year period:
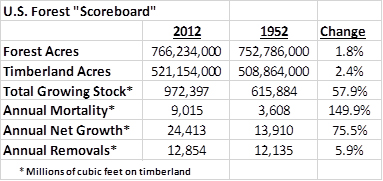
The largest timberland change that has occurred over the last 60 years has been the sharp rise in average annual forest mortality. In that same time span, there has been very little change in the acres of timberland or in the average annual removals. Years of positive annual net growth has resulted in a substantially larger volume of growing stock timber today as compared to 1952. As our nation’s supply of standing timber has increased over the past 60 years, our forests have grown older and more densely stocked, thereby increasing the risk of insect infestation, disease, windthrow, and catastrophic fires. Standing timber volume cannot continue to increase indefinitely.
For our nation’s forests, the score is this: We either need to harvest more timber, or nature will do the job for us!